The ideal solution would be to identify problems before they irritate enough users that an app’s reputation is irreversibly shot. The good news is there’s no shortage of tools for aggregating and analyzing that information, some of which would be difficult, time-consuming or even impossible to collect manually.
App store operators are one source of analytics tools. A recent example is Google’s beta of Mobile App Analytics, which provides information such as which device models are using your app the most. That insight can be useful because Android is highly fragmented, so developers have to decide which devices to optimize for. Mobile App Analytics also tracks usage by version — helpful for tracking the number of users who have upgraded.
Some mobile operators also provide tools. One example is AT&T’s Application Resource Optimizer (ARO), which ferrets out problems such as poor use of caching.
“According to AT&T Labs Research, nearly 20 percent of all HTTP traffic volume is redundant,” says Lisa Burks, AT&T senior product marketing manager. “Nearly all the developers we’ve talked with are surprised to learn that their mobile app is not caching properly. ARO measures this in a few ways — by looking at duplicate content, cache control, content expiration, content pre-fetching and screen rotation.”
Caching isn’t a minor issue, partly because most operators have eliminated flat-rate, unlimited-use data plans. So identifying caching problems is a way to avoid the ire of users concerned about apps using up their monthly data bucket.
“Without proper caching, content will likely be downloaded multiple times,” says Burks. “In our tests of a popular news app, it downloaded the weather 11 times in five minutes.”
Would user feedback have identified that kind of flaw? Maybe — but it’s more likely that users would simply abandon the app, leaving the developer to wonder why.
Knowing what’s going on inside your app is one thing, but it’s equally important to learn about the users who are interacting with your creation. Understanding your user demographics will help you marry the app analytics with the audience you are reaching and create an even better experience.
“With Intel AppUp, we believe it is extremely important for our developers to know as much about their users as possible,” says Alexis Crowell, product marketing manager for Intel AppUp. “We provide resources for our developers to make sure they can maintain that direct connection and garner as much insight as possible.” [Disclosure: Intel is the sponsor of this content.]
App Analytics: Time is Money
Some analytics tools can be helpful for collecting and analyzing non-technical information. For example, appFigures assesses how a price change affects downloads, identifies the day of the week when your app is downloaded most frequently and tracks similar apps’ store rankings.
“Being app developers ourselves, we started appFigures with the modest goal of automating data crunching to make interesting insights easier to spot,” says co-founder Ariel Michaeli. “Since most stores don’t provide an API for reporting, we created a proprietary syncing platform that lets us securely retrieve private data (sales, downloads, updates) directly from a developer’s account. We get public information about the app (ranks, reviews, ratings) directly from the app stores in real-time or very close to it.”
Saving time is also a big part of these tools’ appeal. After all, the less time you spend collecting data and building spreadsheets, the more time you can spend acting on those insights or developing new products.
So what can developers reasonably expect to save? “It could range from 15 minutes a day for just grabbing data from one or several stores to hours or days for actually making sense of the data,” says Michaeli. “In some cases, appFigures makes information accessible, like store-wide hourly ranks and real-time reviews, which would be impractical to get any other way.”
A similar tool, AppViz 2, is designed for iOS. “The average customer can expect to save about 30 minutes a day or more just from the daily sales analysis and chart trending,” says Dustin Bruzenak, co-founder of IdeaSwarm, the company behind AppViz 2. “If you’re doing more in-depth analysis for things like marketing spend or localization targeting, AppViz can save you days of work or more.
“For rankings and reviews, we’re talking about days and days of work to track this data for all countries. Doing that work by hand would be nearly impossible to complete in a timely manner,” says Bruzenak.
Turning App Insights Into Actions
It’s one thing for a tool to collect information and flag interesting highlights. It’s another to make suggestions about how to act on those insights. The latter can help save additional time.
For example, AT&T’s ARO suggests ways to optimize how an app manages its Internet connection. “A typical [app] startup consists of an input burst, followed by a series of bursts spread out over time,” says Burks. “This approach can dramatically slow down the application’s response time and waste energy on the device. A much better approach is to download as much content as quickly as possible when opening a connection.”
This screenshot from ARO illustrates those kinds of bursts.
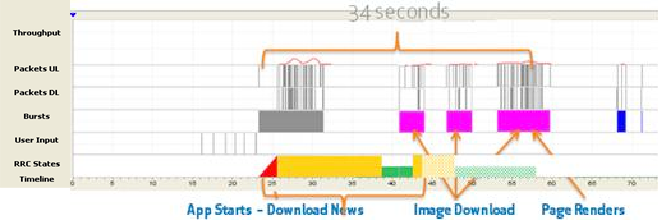
“In this example, if the developer had grouped these four connections more tightly, the page would have rendered at least 15 seconds faster, and the radio would be used less, leading to battery savings,” says Burks.