To that end, let’s start with the key players. There is the PC gaming ecosystem, and there are consoles. But why are consoles typically aggregated in the same bucket?
Let’s take this a step further and break out all the individual consoles: Sony’s PlayStation 2 and 3, Microsoft’s Xbox 360, and Nintendo Wii (I’m excluding handheld, smart and iPhones). There are many reasons I feel it’s important to look at them separately, and chief among them are:
1) Console games can’t play on other competing consoles, so why would we group them in the first place?
2) While PCs don’t all share the same revenue pool, neither do the key console vendors.
In looking up some sales figures that are available to anyone on the Web, I started to build out some generalized ballpark views:
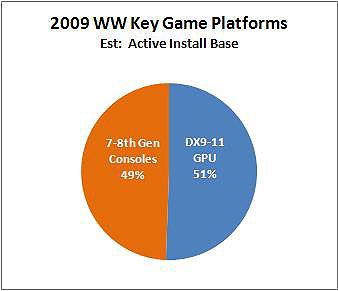
Since I’m not always a fan of pie charts, I like to get even more detail and look at this in a side-by-side bar-graph comparison.
So there you have it. My overly simplified version of how best to portray the various game platforms’ install base. Most of this was based on estimated sell-through at the end date of calendar year 2009. When this methodology is applied, we end up with a much different story in the PC-vs.-console debate.
I certainly understand the value consoles can bring to the table in terms of a being a known target for which to develop. However, what I find most interesting about all this is that even while the PC DX9-11 GPU install base is certainly large, I feel it’s often not leveraged well. A few PC-gaming companies understand this and have learned how to optimize and meet that user demand.
What do you think? Would you add anything to this characterization?